Observations
There is a great deal of evidence that the Earth’s climate has warmed over the last century.
- Warming is apparent in a range of climate indicators including increasing temperatures over land and in the oceans, and increases in sea level.
- Global average temperatures have risen in line with climate model projections for the last 20 years, while global average sea levels are rising near the upper end of the climate model projections.
- [The] observed changes to the climate system are consistent with changes expected due to increasing greenhouse gases.
(p 1)
Greenhouse Gases
- Greenhouse gases (GHGs) influence the Earth’s climate because they interact with flows of heat energy in the atmosphere.
The main GHGs influenced directly by human activities are carbon dioxide (CO2), methane, nitrous oxide, ozone, and synthetic gases. … - The amount of warming produced by a given rise in GHG concentrations depends on ‘feedback’ processes in the climate system …
The net effect of all climate feedbacks is to amplify the warming … - The atmospheric level of CO2 (the most important GHG influenced by human activities) rose from about 280 ppm in 1800 to 386 ppm in 2009, and is currently increasing at nearly 2 ppm per year.
- CO2 levels are rising mainly because of the burning of fossil fuels and deforestation.
Over half of this CO2 input to the atmosphere is offset by natural CO2 ‘sinks’ in the land and oceans … - To have a 50:50 chance of keeping human-induced average global warming below 2ºC, it will be necessary to stop almost all CO2 emissions before cumulative emissions reach one trillion tonnes of carbon.
The world has already emitted more than half of this quota since the industrial revolution, and (at current growth rates for CO2 emissions) the rest will be emitted by the middle of this century. - Climate change is a risk management issue — the longer we take to act and the weaker our actions, the greater the risk of dangerous outcomes.
Projections
- The best estimate of annual average warming by 2030 (above 1990 temperatures) is around 1.0ºC across Australia …
- Drying is likely in southern areas of Australia, especially in winter, and in southern and eastern areas in spring, due to a contraction in the rainfall belt towards the higher latitudes of the southern hemisphere. …
- Intense rainfall events in most locations will become more extreme, driven by a warmer, wetter atmosphere.
The combination of drying and increased evaporation means soil moisture is likely to decline over much of southern Australia.
An increase in fire-weather risk is likely with warmer and drier conditions.
Attribution of observed climate changes
[Attribution] studies compare changes in observed climate with various simulations or experiments using coupled atmosphere–ocean general circulation models, also known as Coupled Global Climate Models or Earth System Models …
The combination of observations and climate models are currently the best tools available to differentiate the natural and human-induced effects on the climate system because experimentation with real climate systems is not practically possible.
Experiments using climate models typically include:
- increasing greenhouse gases,
- changing solar radiation,
- changing atmospheric aerosols due to volcanoes and industrial pollution, and
- changing stratospheric ozone.
It is extremely unlikely that the observed global-scale warming is due to natural variability.
Simulations of the last 100 years of climate that include both human and natural influences on climate successfully reproduce observed patterns of global temperature change, whereas simulations that do not include human factors fail to reproduce the observed patterns. …
Consistency [of] warming over [both] land and [ocean indicates] that temperature changes are real rather than an artefact of recording practices.
This is because land and sea temperatures are recorded very differently and are influenced by quite different factors, yet they reveal the same patterns of warming. …
[Because natural annual regional variability] is larger than … over the globe as a whole [it is] difficult to separate the effect of longer term changes from natural variability [at regional scales].
Drought conditions persisted in the south-east from around 1996 to 2010 …
Research has shown that some aspects of this drought are consistent with global warming, but it has not been possible to unequivocally attribute this dry period to the enhanced greenhouse effect.
(p 6)
The drought in the south-west of WA … has been linked with shifts in prevailing weather patterns (e.g. storms and cold fronts) and a general reduction in rainfall associated with those systems.
Some of these changes have been shown to be consistent with human influences (greenhouse gas increases and decreases in stratospheric ozone) in combination with natural climate variability. …
[Increased] atmospheric pressure in … the subtropical ridge (a zone of high pressure or descending dry air across the southern half of the continent, associated with clear skies and low rainfall), has also been shown to be associated with the decline in rainfall across southern Australia, as well as being consistent with human-induced climate change.
There is no unequivocal evidence that long-term changes in the Indian and Pacific oceans, such as changes to the El Niño-Southern Oscillation, have had a major influence on rainfall trends over Australia …
(p 7)
Contents
Observations
Greenhouse Gases
Projections
Commonwealth Science and Industrial Research Organisation
- Climate Change: Science and Solutions for Australia, CSIRO, 2011.
Helen Cleugh, Mark Stafford Smith, Michael Battaglia & Paul Graham: Editors.
Observations of Global and Australian Climate
Karl Braganza: National Climate Centre, Bureau of Meteorology.
John Church: CSIRO Wealth from Oceans Flagship.
Australian terrestrial temperature
[The instrumental record shows] that surface temperatures in Australia rose by just under 1ºC over the 100 years from 1910 to 2009.
Global average temperatures have risen by about 0.7ºC over the past century.
Warming was modest in Australia in the early part of the 20th century, followed by a slight decline from around 1935 to 1950, and then a rapid increase until 2010.
Australian average temperature has increased by around 0.7ºC since the middle of the 20th century. …
The past decade (2000 to 2009) was Australia’s warmest decade on record. …
[Years] of high rainfall are typically associated with cooler than average temperatures, while years of low rainfall and drought are typically warmer than average.
(p 2)
Some regions have experienced temperature increases of up to 2ºC over this time, while other regions have experienced little or no change.
The weakest warming trends are in north-western Australia, which has also seen an increase in rainfall since 1960.
The long-term trend in Australia-wide average temperature, however, is clear and distinct from the observed background variability. …
Minimum (night-time) temperatures increased more rapidly than maximum (daytime) temperatures over most of the 20th century.
[The] frequency of extreme cold weather has decreased across most of Australia, while the frequency of warm weather has increased.
[The] number of days with record hot temperatures has increased each decade over the past 50 years.
Evidence is emerging of increased frequency of severe heatwaves and warm extremes.
(p 3)
Australian sea surface temperature
Globally averaged sea surface temperatures have increased by about 0.7ºC.
Temperatures of the surface waters surrounding Australia have warmed by about 0.9ºC since 1900, with about 0.4ºC of that warming having taken place in the past 50 years. …
Significant seasonal warmth caused notable episodes of coral bleaching on the Great Barrier Reef in both 1998 and 2002.
Australian rainfall
… Rainfall in the tropical north is generally monsoonal, with a pronounced wet season over the summer months and dry for the remainder of the year.
Rainfall in the south of the continent … is dominated by winter storm activity.
Much of the rest of the continent, particularly the interior, is either arid or semi-arid.
This very large regional variability means that Australian average rainfall is not such a meaningful national measure as Australian average temperature.
Australia is subject to extreme rainfall variability …
Incursions of moist tropical air and tropical cyclones result in occasional deluges across the desert and semi-desert interior.
Similarly, vast movements of oceanic heat and atmospheric circulation over the Pacific Ocean, known as the El Niño-Southern Oscillation, are associated with periodic droughts (El Niño) and, alternatively, heavy rainfall (La Niña) across the eastern and southern parts of the continent.
Sea surface temperatures in the Indian and Southern oceans, as well as atmospheric circulation around the Southern Hemisphere as a whole, also make strong contributions to Australian rainfall variability.
It is difficult to characterise long-term changes in Australian rainfall amidst this background of large, natural, year-to-year and decade-to-decade variability. …
(p 4)
Cool season (April to November) rainfall in the south-west of Western Australia (SWWA) and in south-eastern Australia over the last 15 to 30 years has shown changes that are large compared with natural variability.
This is particularly true for SWWA, where winter season rainfall has declined by around 15% since the mid-1970s.
The rainfall declines across south-eastern parts of the country, including the lower Murray–Darling Basin (MDB), have been associated with widespread, long-term drought.
As with SWWA, the most statistically significant rainfall reductions have occurred during the autumn and winter seasons, and have occurred since the mid-1990s.
While heavy rainfall across the south-east during 2010 brought an end to a 13-year sequence of below average annual rainfall in Victoria, the heavy rainfall mostly occurred during spring and summer.
Significantly, the 15% decline in autumn/winter rainfall has been associated with much larger reductions in stream flow (up to 60% for SWWA and the lower MDB) … and hence water storages, in southern drought-affected regions. …
The timing of the rainfall deficits … can amplify the impact on soil moisture, water storages, and stream flows.
[Rainfall] in autumn and early winter soaks the catchments so that surface water runs off into creeks and water storages during late winter and spring.
[When] autumn rain fails … more winter rainfall is taken up by vegetation and dry soils, resulting in less rainfall making its way into water storages.
It [2010,] despite heavy rainfall in Victoria during the second half of the year, Melbourne recorded its 14th consecutive year of below average inflows to water storages …
(p 5)
Observations from the oceans
Temperature
The oceans are the Earth’s true thermometer. …
The vast amounts of heat that the oceans have absorbed in recent decades are causing them to expand and therefore to rise …
[Observations] between 1961 and 2008 indicate that the upper few hundred metres of the ocean absorbed well over 100 billion trillion joules of energy (Figure 1.3).
This vast heat storage slows the rate of warming in the atmosphere and affects the regional distribution of these changes.

Figure 1.3
(p 8)
Updated estimates of changes in upper ocean heat content relative to 1970.
Salinity
Parts of the sea … have become measurably saltier owing to increased evaporation or less rainfall, or both, while other parts have become fresher as they are diluted by increased rainfall or decreased evaporation, or both. …
[There] has been a southward shift of the Antarctic Circumpolar Current — the vast current that circles the planet around Antarctica — and an increasing southward extension of the East Australian Current associated with wind changes in the southern Pacific.
There also are indications of recent changes in the temperatures and salinities of deep ocean currents, such as those that carry cold bottom water northwards away from Antarctica.
These currents … are key components in the distribution of heat around the planet.
Acidification
The oceans also absorb vast amounts of CO2, as well as storing heat.
They currently remove about 25% of the emissions of CO2 produced by human activities, …
A direct result of this CO2 uptake is the gradual acidification of the oceans [over] the last 250 years …
[The] near surface ocean pH [has decreased] by about 0.1 and is expected to [fall] by a further 0.2–0.3 by 2100.
This could have profound effects on corals and plankton [-] and other marine organisms with carbonate skeletons [- affecting] the entire marine food chain.
(p 9)
Sea levels
… Rates of sealevel rise coming out of the last ice age averaged about 1 m per century for many thousands of years, with maximum rates of 2-4 m a century. …
Sea level stabilised around 3,000 years ago [before beginning] to rise again in the late 19th century.

Figure 1.4
(p 10)
Global averaged sea-level anomalies relative to 1880.
The solid black line is estimated from coastal and island tide gauges and the red line is sea level measured by satellite altimeters.
The average rate of rise from 1900 to 2000 was about 1.7 mm/year.
The rate of rise measured by satellite altimeters since 1993 has been about 3.2 mm/year and from tide gauges about 2.8 mm/year.
Sedentary coastal societies have developed during this period of stable sea level and they are potentially vulnerable to future sea-level changes.
About 150 million people live within about a metre of high tide levels today and the near-coastal zone generates some US$1 trillion of global economic activity.
Global sea levels are currently rising … at a rate near the upper end of the Intergovernmental Panel on Climate Change projections.
Rising sea levels have already significantly increased the frequency of high coastal sea-level events in Australia and overseas.
These occur when storms and strong onshore winds coincide with high tides.
Current climate models project that by 2100 sea level could be about 20 to 60 cm above 1990 values [from thermal expansion alone].
[With the] contribution of [melting] ice sheets … sea level could rise a further 10 to 20 cm (for a total range in 2100 of about 20 to 80 cm).
[However, the] current understanding of ice sheet processes is inadequate and larger values cannot be excluded.
(p 11)
The main contributions to sea-level rise in the past half century have been expansion of the upper layers of the oceans as they warm and increased discharge from glaciers worldwide.
Ice sheets over Greenland and Antarctica have played a comparatively smaller role in raising sea level so far, but there are indications they may contribute more in the future.
The future evolution of ice sheets is critically important because the Greenland ice sheet alone contains enough water to raise the global sea levels by about 7 m and the West Antarctic ice sheet could add about a further 5 m. …
[There] are indications of a recent increase of the flow of ice into the ocean from both Greenland and Antarctica (particularly in West Antarctica).
This follows the penetration of warm ocean water onto the continental shelf under the ice shelves, which is melting the ice shelves at their base and contributing to their decay with a resultant more rapid flow of ice into the ocean. …
One of the major uncertainties in our knowledge of how much ice sheet loss will contribute to future rises in sea level is how much these rapid dynamic responses of the ice sheets will add to other contributions to sea-level rise. …
Current rates of emissions of greenhouse gases mean that global average temperature is likely, late in the 21st century, to cross the threshold that leads to ongoing and potentially irreversible melting of the Greenland Ice Sheet …
(p 12)
The rise in sea level projected for the 21st century [is] likely to cause coastal flooding events that now occur once a century to occur more than once a year … at many Australian locations.
Tens of millions more people worldwide will be exposed to the hazards and cost of adapting to increased coastal flooding and erosion.
Many of the world’s megacities, from Dhaka and Shanghai to New York, would be threatened by a sea-level rise of metres over the longer term if greenhouse gas emissions continue unabated.
Longer term commitment
The huge heat and carbon storage capacity of the ocean and the long time scales over which the ocean responds to changes in atmospheric conditions mean that the oceans will continue to warm and affect the Earth’s climate for centuries to come, even if greenhouse gas emissions are stabilised at levels substantially lower than in the late 20th century.
(p 13)
Greenhouse Gases and the Earth's Climate
Michael Raupach & Paul Fraser: CSIRO Marine and Atmospheric Research.
Water vapour is also a major greenhouse gas, but its concentration in the atmosphere is not influenced directly by human activities; rather, it is controlled mainly by the Earth’s temperature.
(p 15)
The atmosphere (including its GHGs) is largely transparent to the Sun’s energy, most of which arrives in the form of light.
At the Earth’s surface [part of] this energy is … reflected and [the rest] absorbed and re-radiated as heat. …
The GHGs in the atmosphere absorb and re-radiate much of the outgoing heat energy.
[Minute] particles or droplets floating in the atmosphere, known as aerosols, … reflect incoming solar radiation (light) and [also] absorb and re-radiate outgoing heat.
[All] of these factors … maintain the planet at about 32ºC warmer than it would otherwise be.
[Net] radiative forcing [is] the net [transfer rate] of heat energy to the entire planet …
[When] the rate of energy input is positive [this extra heat builds up in the atmosphere and oceans, warming the planet].
The [total] net radiative forcing in 2005 was +1.6 W/m^2 (Watts per square metre) …
This is equivalent to … running a 1 kW electric radiator on an area the size of a suburban block — day and night, all year round, for every block-sized patch of the entire planet’s surface.
It is this massive input of energy to the Earth’s surface and lower atmosphere that is causing global temperatures to increase.
(p 16)
This is similar to the radiative forcing from CO2 alone [+1.66], because at present the contributions from non-CO2 GHGs [methane, nitrous oxide, synthetic gases, and ozone] and from aerosols approximately cancel one another out.
This approximate cancellation is unlikely to continue, because a probable future decrease in pollution-based aerosols in the atmosphere will reduce the negative (that is, cooling) aerosol contribution to radiative forcing, resulting in increased warming.
(p 17)

Figure 2.2
(p 19)
Global radiative forcing due to long-lived GHGs from 1900 to 2009 assessed from data measured in the CSIRO and AGAGE networks …
Would you like to know more?
Feedbacks in the climate system
Knowledge of the radiative forcing tells us how much extra energy the Earth is retaining in the lower atmosphere, but it does not tell us the resulting warming.
The amount of warming depends on many internal ‘feedbacks’ in the climate system. …
The global average concentration of water vapour [rapidly] increases in response to an increase in global temperature, due to the increased water-retaining capacity of a warmer atmosphere.
Because water vapour is [also] a GHG, [this] approximately doubles the amount of warming that would otherwise be produced …
A second, much slower, reinforcing feedback arises … as warming initiates a melting of the [polar ice caps], the consequent darkening of the surface (as land or ocean from under the ice is exposed) leads to the absorption of more radiation, and thus further warming.
A third important class of feedbacks involves the natural cycles of greenhouse gases, such as CO2 and methane, which respond to temperature and moisture in ways that can amplify an initial warming.
The net effect of all these processes is … an overall reinforcing effect.
A doubling in CO2 from pre-industrial levels (280 ppm) to around 550 ppm [amplifies] the long-term average warming [from about 1ºC (without feedbacks) to] about 3ºC. …
[This conclusion has been corroborated] independently from climate models using ice-core records of climate fluctuations over the last 850,000 years.
These show that small fluctuations in the Earth’s orbit around the Sun led to large changes in global temperature through the same set of feedbacks that … amplify the climate change from human emissions of CO2 and other GHGs.
These records yield a value of about 3ºC for fast climate sensitivity to a doubling of CO2, similar to the estimates from various climate models.
(p 21)

Figure 2.3
(p 22)
There are close connections between global temperature, atmospheric water vapour and cloudiness, the extent of polar ice caps, and levels of greenhouse gases in the atmosphere.
When one of these is disturbed, such as by human activity, the others react through processes that amplify the original disturbance until a new, different, climate equilibrium is reached.
The disturbance driving the glacial cycles over the last million years came mainly from fluctuations in the Earth’s orbit around the Sun (grey box in upper diagram). …
The disturbance in modern climate change comes largely from human-induced changes in atmospheric CO2 and other greenhouse gas levels (grey box in lower diagram).
The disturbance is amplified by similar reinforcing processes in both cases.
The carbon dioxide budget of the Earth’s atmosphere
[Atmospheric and ice core] measurements allow us to trace the dramatic rise in CO2 levels from about 280 ppm before the start of the industrial era around 1800 to 386 ppm in 2009 …
(p 23)

Figure 2.4
Southern Hemisphere atmospheric CO2 levels over the past 1,000 years, sourced from CSIRO data.
For several millennia before the industrial revolution … the CO2 budget of the atmosphere was nearly in balance: natural inflows (transfers of carbon from land and ocean systems into the atmosphere as CO2, together with small contributions from volcanic activity) were approximately equal to natural outflows (transfers of carbon out of the atmosphere into land and ocean systems). …
Since around 1800, there has been an additional large inflow of CO2 [into] the atmosphere from …- the burning of fossil fuels (coal, oil, and gas),
- cement production and other industrial processes, and
- deforestation or land clearing (occurring now almost entirely in tropical regions).
The land CO2 sink derives from an imbalance between plant growth [and] decay [arising from:]- the stimulation of photosynthesis by increasing atmospheric CO2 levels (though [water and] other nutrients must also be available for a sustained increase in plant growth);
- forest regrowth after deforestation that occurred many decades ago;
- changes in fire regimes; and
- changes in ecosystem structure, such as the replacement of tropical C4 grasses by woody C3 plants that store more biomass.
The ocean CO2 sink occurs because CO2 dissolves in ocean waters (also increasing ocean acidity) …
This dissolved carbon is then transported to the deep ocean both by overturning circulations and by the sinking of dead organisms …
In the period 2000–8,- 82% of humanity’s CO2 emissions came from the burning of fossil fuels …
- 3% from other industrial sources.
These emissions together grew by 3.4% per year. - The remaining 15% of emissions, from deforestation, were steady.

Figure 2.5
(p 25)
Sources and sinks of atmospheric CO2.
Those above the zero-line represent anthropogenic additions to the atmosphere (inflows) …
[Those] below are sinks for CO2 (outflows), together with the accumulation in the atmosphere.
Units are in petagrams of carbon per year (Pg = petagram; 1 petagram = 1015 grams = 1 billion tonnes).
The small residual reflects minor discrepancies in independent measurements of different terms.
Land and ocean CO2 sinks respectively removed 30% and 25% of all anthropogenic CO2 emissions over the period 2000–8, leaving about 45% to accumulate in the atmosphere.
[These sinks] constitute a massive ecosystem service that helps to mitigate humanity’s emissions. …
[While] the land and ocean CO2 sinks are continuing to grow with the rise in atmospheric CO2, they are progressively [losing ground] against the even more rapidly growing emissions. …
[On] land, plants experience ‘diminishing returns’ in extra CO2-induced growth with rising concentrations of atmospheric CO2.
On the oceans, climate change and ozone depletion drive stronger winds over the Southern Ocean … which may cause deep carbon-rich waters to upwell and release their CO2 back into the atmosphere …
[Consequently, the] fraction of our CO2 emissions [soaked by the sinks] has diminished in recent decades.
(p 26)

Figure 2.6
(p 27)
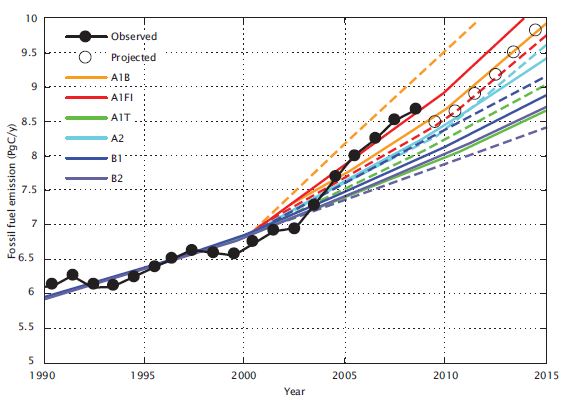
CO2 emissions from fossil fuels measured in petagrams of carbon emitted per year [for the period 1990–2015.]
Observed data are shown as black … points.
Solid coloured lines are average future emissions in six scenario families from the IPCC Special Report on Emissions Scenarios (SRES).
Corresponding dashed coloured lines denote marker scenarios used in IPCC climate change projections. …
Open circles … are estimated emissions based on Gross World Product (GWP) projections …
From 2000 to 2007, the growth rate of observed emissions was 3.4% per year, which exceeds almost all assumed scenarios generated in the late 1990s.
This pulse of CO2 emissions growth is attributable to strong global economic growth centred in China, India, and other rapidly developing economies, and the lack of effective reductions in emissions in developed countries. …
The global financial crisis of 2008–2009 caused a temporary [dip] equivalent to about 6 weeks’ worth of total global emissions.
Budgets for other greenhouse gases [Figure 2.2]
[The] second most influential greenhouse gas [is] methane.
[The] dominant natural source … is wetlands, with a smaller natural source from termite activity.
[Major] sources form human activities include:- agriculture (rice and ruminant livestock production),
- waste disposal in landfill,
- gas leaks from pipelines and coal mines, and
- biomass burning.
The main sink for methane is chemical degradation in the atmosphere.
(p 28)
The average atmospheric methane level in 2009 was 1789 parts per billion — more than twice what it was in the pre-industrial era.
There has been little growth in methane levels over the past decade, suggesting that methane emissions and their removal from the atmosphere by oxidation to CO2 are coming into balance. …
The nitrous oxide concentration in 2009 was 323 ppb, about 20% above its pre-industrial level.
The dominant human-influenced source is agriculture.
Emissions of nitrous oxide … continue unabated. …
[The concentration of] synthetic GHGs — largely chlorofluorocarbons (CFCs) and hydrofluorocarbons (HFCs) — [has recently stopped growing.]
[However, this] is likely to resume because of the large projected growth in future emissions of HFCs [from] modern refrigerators and air-conditioners.
… HFCs were introduced to replace … CFCs, which were causing stratospheric ozone depletion.
(p 29)
Greenhouse gases and climate in the future
[A] globally averaged warming of 2ºC above pre-industrial temperatures is widely used as a benchmark at which the effects of climate change start to have dangerous risks and impacts. …
To have a 50:50 chance of keeping global warming below 2ºC, it will be necessary to stop almost all CO2 emissions before our cumulative emissions reach 1,000 billion (one trillion) tonnes.
{The cumulative total amount of CO2 emitted from all human sources in the past 250 years is now around 530 billion tonnes.}
If CO2 emissions keep growing at their present (2000–10) rate, we will emit another 470 billion tonnes by around 2045.
If we stabilise emissions from the present time (2010) onward without further growth, we will reach 1,000 billion tonnes by around 2060. …
… 50:50 is not good odds when it comes to avoiding danger …
[To] improve those odds, the cap on cumulative emissions needs to be lower. …
[Several] processes might affect the peak warming induced by a given cumulative input of CO2.
(p 30)
Feedbacks on land and ocean CO2 sinks
[Feedbacks] between carbon dioxide concentrations and changes in climate tend to increase warming, but the possible range of responses remains large.
[There] are limits to the supply of nutrients (eg nitrogen and phosphorus), which are essential to maintain the land CO2 sink.
Mobilisation of carbon from disturbed pools
- [Nearly 1,700 billion tonnes of] carbon [is] locked up in frozen soils in the Arctic region …
[Warming] over the next 100 years could release around 100 billion tonnes of this carbon to the atmosphere as CO2 or methane. - [Around] 30 billion tonnes [of] carbon could be released … by drainage or fire [from tropical peatland soils, mainly in South-East Asia]
- [There is] an as yet unquantified risk [from] frozen deposits of ancient methane beneath the Arctic seabed.
Release of the ‘aerosol brake’
[Measures] taken to improve air quality in the world’s big cities could reduce the amount of sulphate aerosols entering the atmosphere and so release the ‘aerosol brake’ (that is, cooling effect) on warming.
[It is highly uncertain as to how large this effect might be.]
(p 32)
Conclusion
Climate models indicate that it is also very likely that warming and other climate changes will continue and accelerate through the coming century if emissions of greenhouse gases continue to increase.
Our growing understanding of the feedbacks that can both dampen and reinforce climate change suggest that, in aggregate, these feedbacks reinforce the warming trend.
[There is] a difficult-to-quantify risk of crossing an important threshold and triggering serious, unexpected change that is potentially irreversible for a long time.
Climate change will pose an increased risk to human wellbeing in the future.
(p 33)
Future Australian Climate Scenarios
Penny Whetton: CSIRO Marine and Atmospheric Research.
[Global climate models (GCMs)] are mathematical representations of the Earth’s climate system that are based on the laws of physics and are used to project the future climate.
[Despite their limitations, they] remain the best tools we have for exploring the climate of the future …
(p 35)
Climate projections for Australia
Two main uncertainties continue to qualify the projections of future climate …- the level of humanity’s future greenhouse gas emissions; and
- the precise response of the Earth’s climate system to those emissions.
[It is] clear that greenhouse gas emissions are growing strongly, with observed emissions from 2000 to 2007 exceeding almost all assumed emission scenarios generated in the late 1990s. …
Rainfall is one of the most difficult phenomena to predict …
[Climate] projections suggest- increased rainfall in the Earth’s mid-to-high latitudes,
- decreased rainfall in the mid-latitudes around 25–30º north or south of the Equator (where southern Australia sits), and
- increases near the Equator.
Temperature predictions have a higher degree of confidence than rainfall predictions. …
All of the GCMs point to global warming, but the pace and extent depend on the level of human emissions and on feedback mechanisms in the Earth’s climate system captured in the models.
There is a general tendency for warming to be stronger over land than over sea.
(p 36)
The Earth already is committed to further warming and climate change due to existing greenhouse gas concentrations in the atmosphere, irrespective of any future increases. …
Temperature
[Estimates] of annual average warming- [By] 2030 (above 1990 temperatures) is around 1.0ºC across Australia, with warming of 0.7–0.9ºC in coastal areas and 1–1.2ºC inland. …
- [By] 2050 ranges from 0.8 to 1.8ºC (low greenhouse gas emission scenario) and 1.5 to 2.8ºC (high greenhouse gas emission scenario).
- By 2070 warming is expected to be between 2.2ºC [and 5ºC.]
Rainfall
Future changes in summer tropical rainfall in northern Australia remain highly uncertain.
(p 38)
Regional climate changes
New South Wales and ACT
- Average stream flow decreases across the Murray–Darling Basin by 2030.
- 10–40% increase in the number of extreme fire danger days in Canberra by 2020.
- Annual heat-related deaths in Sydney rise from 176 (1990s) to 364–417 by 2020.
Victoria
- Area inundated by a 1-in-100-year storm surge in Gippsland may increase 15–30% by 2070. …
- 20–65% increase in the number of extreme fire danger days in the Bendigo region by 2020.
- Potential doubling in the number of days over 35ºC in Melbourne by 2070.
South-East Queensland
- Less water for cities, industries, agriculture, and natural ecosystems.
- Less frost damage to crops, higher wheat yields but lower wheat quality, increased pest and disease risk.
- 20% increase in intensity of a 1-in-100-year rainstorm could … inundate 7,000 properties in the Nerang catchment in southern Queensland.
Southern South Australia
- Farming of land at the drier fringe likely to be increasingly marginal if rainfall declines substantially.
- Grape quality in the Barossa Valley likely to decline due to higher temperatures.
- Potential doubling in the number of days over 35ºC in Adelaide by 2070.
South-west Western Australia
- Decline in annual stream flow.
- Wheat yield significantly reduced by 2070.
- Potential almost doubling of the number of days over 35ºC in Perth by 2070.
Northern coastal Queensland
- Sea-level rise likely to cause salt-water intrusion and inundation in some Torres Strait Islands.
- Significant loss of biodiversity in the Great Barrier Reef and Queensland Wet Tropics by 2020.
- Risk of inundation by a 1-in-100-year storm surge in Cairns area may more than double by 2050.
Tasmania
- 21% of the Tasmanian coast is at risk of erosion and recession from sea-level rise.
- Strengthening of the East Australian Current may result in subtropical marine species moving into temperate waters, altering the habitat of many species.
- Potential doubling in the number of days over 35ºC in Adelaide by 2070.
Top End
- Remote area communities to face increased exposure to heat stress, fire, diseases, extreme rainfall events, and flooding.
- 80% loss of biodiversity in Kakadu wetlands for a 30 cm sea-level rise.
Extreme events
[Based on 13 climate model simulations the] frequency of very dry conditions is expected to increase in Victoria and Tasmania and south-west Western Australia …
Fire Danger Rating Increase in the number of days by: 2020 2050 Very High 2% to 30% 5% to 100% Extreme 5% and 65% 10% and 300%
For example, Canberra may have an annual average of 19 to 25 very high or extreme fire danger days by 2020 and 22 to 38 days by 2050, compared with the present average of 17 days. …
(p 42)
Studies … point to a likely increase in the proportion of tropical cyclones in the more intense categories (category 4 or 5), but a possible decrease in the total number of cyclones per year.
Abrupt changes and tipping points
There is a risk of abrupt changes as the climate shifts from one state to another … such as major changes in the ocean’s thermohaline circulation: the global ocean current that distributes heat around the planet, leading to step-changes in warming or in extreme events.
[Once] they have occurred, it may be hard for the planet to return to its previous steady state.
For example, once Greenland’s ice cap is committed to melting it is unlikely to reform for thousands of years …
Conclusion
Australia’s climate projections have been under development for more than 20 years. …
These projections can [be used to examine] the implications of a changing climate on- agricultural production,
- water availability,
- health-care issues,
- bushfire danger, and
- vulnerability to storms or flood damage
[This] makes it possible to start drawing up action plans at national, state, regional, and local levels to adapt to the most likely changes.
(p 43)